


BVN, mobile phone ownership
This chart shows the correlation between mobile phone usage and type of phone for BVN ownership

BVN ownership at state or residence
This map shows the BVN ownership rate across the thirty six states in the country

Gender and BVN ownership
This chart plots ownership of Bank Verification number against the gender of respondents according to a 2023 Access to Finance Survey (A2F) survey of more than 111, 306, 095 people undertaken in 2023.

NIN ownership and Bank status
This chart shows the correlation between bank account ownership and NIN ownership

NIN ownership and type of phone
This chart shows the correlation between mobile phone usage and type of phone for NIN ownership

NIN and mobile phone ownership
This chart shows the correlation between mobile phone usage and type of phone for NIN ownership
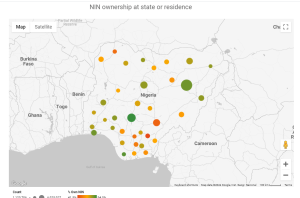
NIN ownership at state or residence
This map shows the NIN ownership rate across the thirty six states in the country
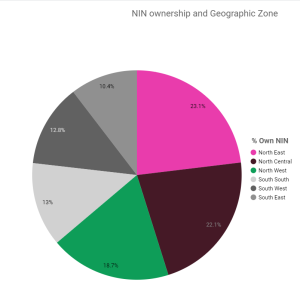
NIN ownership and Geographic zone
This map shows the NIN ownership rate across the country’s six geopolitical zones
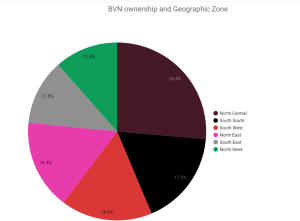
BVN ownership and Geographic Zone
Respondents in the North West are the least likely to own BVN while respondents in the South West are the most likely to have their BVN
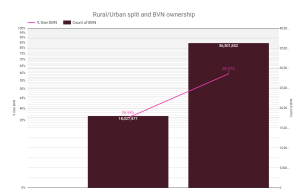
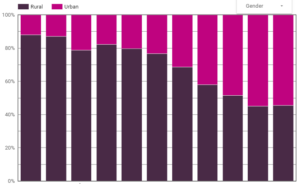
Rural/Urban split and BVN ownership
Respondents in Urban areas are considerably more likely to have a BVN than those in rural areas who record a higher than average rate of non-BVN ownership
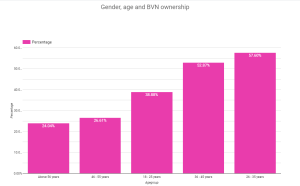
BVN ownership and age group
BVN ownership is lowest among respondents within the age group 18-25 and more generally across people below the age of 35. While the data shows that young people are more likely to not own a BVN, there is also higher than average numbers of non-BVN ownership in for respondents over the age of 51.
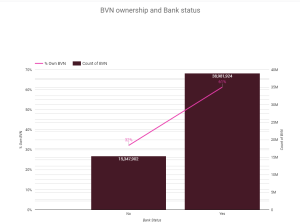
BVN ownership and Bank status
Respondents with bank accounts are more likely to own an BVN compared to their counterparts without bank accounts.
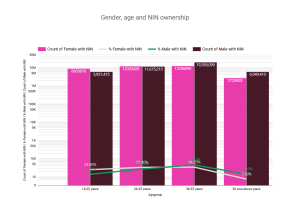
Gender, age and NIN ownership
Women are least likely to own BVNs than men and while there is a gender gap among respondents, it is not significant recording only a 1% difference.
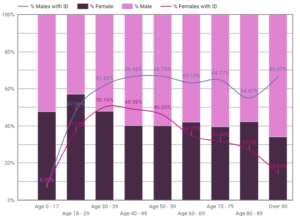
Gender, National Identity & Age
Women Over the age of 39 are progressively less likely to own and ID than their male Counterparts and the gender gap expands the older the respondents get indicating that the older the woman is, the less likely she is to have an ID.
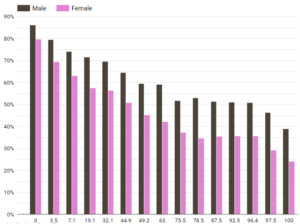
Gender, National Identity and Poverty
Women are less likely to have ID than men at every level of the World Bank’s Poverty Probability index and the gender gap widens as they get poorer.
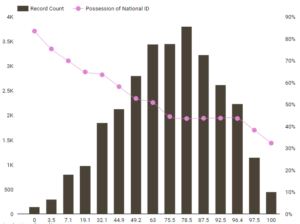
Understanding the link between poverty and ownership of Nigeria’s National Identity Number
The likelihood of respondents having ID decreases at every percentile of the World Bank’s Poverty Probability Index, demonstrating clearly that the poorer you are, the less likely you are to have ID.
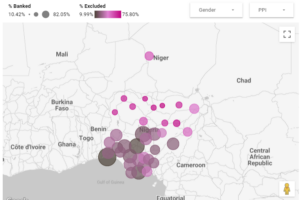
National identity registrations & financial exclusion by state
This map shows the number of national identity registrations by State, mapped against the level of financial exclusion.
Financial inclusion, poverty and respondents with and without ID
Financially excluded respondents with a high likelihood of poverty based on the World Bank’s Poverty Probability Index, are considerably more likely not to have National Identity, than respondents who are banked indicating a strong correlation between the communities without National Identity and those who are financially excluded.

National identity enrolment centres and registrations
There is a clear link between the number of enrolment centres in a State, and the number of people who have registered for National Identity Numbers. The more enrolment centres, the higher the registrations.
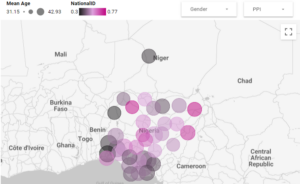
Age, state and national identity
There is a clear cluster of low national identity ownership in the South South and South East, along with interesting spikes in identity ownership in the sample in Zamfara, Borno and Adamawa which may be indicative of specific vulnerable communities in the sample, such as Internally Displaced People.
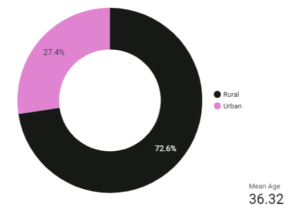
Location and national identity
Respondents in Urban areas are considerably more likely to have a National Identity Number than those in rural areas.

Education and financial inclusion
More than 89% of respondents with a university degree or above are likely to be financially included, while only 29% of respondents who only complete primary school are likely to be financially included. The lower your level of education, the less likely you have a bank account.
Education and urban/rural
Respondents’ education levels are progressively higher for urban communities than for rural communities.
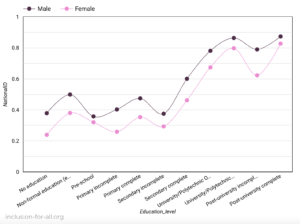
Education and national identity
Respondents are generally more likely to have national ID the higher their level of education. Gender gaps exist in ownership of National ID at every level of the education system, with significant gaps for those with no education, incomplete primary education and in-complete post university education.
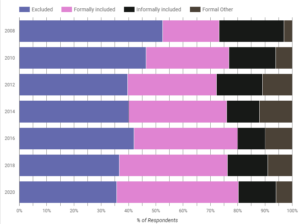
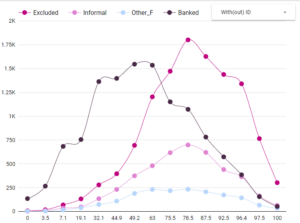
Financial inclusion in Nigeria since 2008
While Nigeria’s banked population has more than doubled since 2008, the percentage of respondents who are excluded from the financial system is progressing too slowly to achieve current Federal Government targets and the proportion of informally included respondents remains high.

National identity number and mobile phone ownership
In a continued drive to enforce and accelerate NIN enrollment, NIMC and the Ministry of Communications and Digital Economy on April 4, 2022, took the decision to disconnect mobile lines yet to link their NIN to their SIM cards. This immediately restricted outgoing call services of more than 30 million Nigerian mobile lines. Our graph shows that 73.1% of mobile phone owners in the poorest segment of society did not have a NIN in 2020; and therefore more likely to be directly affected by the restrictions on mobile phone use. This confirms that mobile phone ownership does not indicate NIN ownership and it is progressively exacerbated as you get poorer.